master in intuitive Interface in the Neuro fMRI
Neuroimaging biomarkers. morphological (for example, MRI), functional (eg, functional MRI), using brain imaging techniques micro areas (for example, perfusion MRI), metabolism (for example, PET-FDG), or molecular chemical aspect (eg, MR spectroscopy).
Neuroimaging biomarkers of Alzheimer's disease, including FDG-PET of atrophy of MRI and brain and hippocampus, the (Bateman et al. 2012) and the measurement of β-amyloid deposition of the PIB-PET of brain metabolism.
Neuroimaging biomarker of multiple sclerosis (MS) is, T2 lesions of counting and volume, there is a lesion enhancement, and black holes. Morphometry of brain atrophy of brain, can be used to measure the biomarkers aspects of regression of the disease.
The neuroimaging biomarker of ischemic stroke, in the acute phase, the volume of ischemic heart, as determined by the map of the apparent diffusion coefficient (ADC), the volume of ischemic penumbra is, MR perfusion parameters based TMAX it is estimated by. In chronic stage, lesion of ischemic lesions, measured on the FLAIR image.
REFERENCE
Dr. Laurent Hermoye, CEO in Imagilys. :Neuroimaging Biomarker.
http://www.imagilys.com/neuroimaging-biomarkers-CNS-clinical-trials/
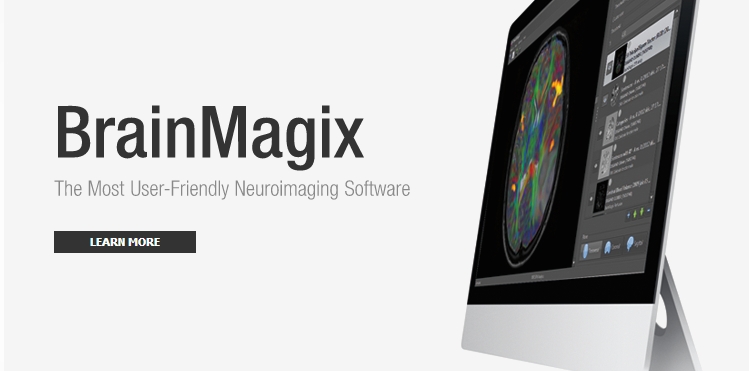
BrainMagix
BrainMagix developed by Imagilys Inc. (Brussels, Belgium) is one of the few computer system validated CE marked functional MRI image measurement tool by intuitive interface.
LISIT was contracted with Imagilys as a distributor for neuroimaging biomarker measure for Brain related clinical trials in Japan officially.
Visualize the MRI data, conversion of data format, there are many software for the statistical analysis. One of well known research tool for fMRI is called SPM (Statistical Parametric Mapping) also, but is a free tool that can be run in the fourth generation language development environment of Matlab. SPM has not been obtained under the compliance validated process of Alzheimer's disease, multiple sclerosis or ischemic stroke measure to judge a therapeutic efficacy and safety like international clinical trials.
BrainMagix is an authentication products with a CE mark. The CE Marking, it is intended to represent that the product in the EU legislation defining the CE marking applies to products will meet. (However, because it is a non-regulatory software in Japan, you can only for clinical research and clinical trials, and use in education.)
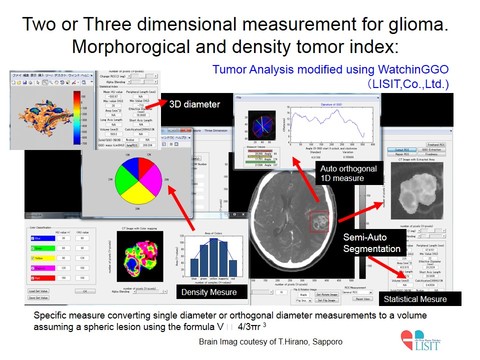
Tumor Analysis of Glioblastoma
LISIT is developing order made image analysis tool for Brain tumor researchers.
Analytic measure tool of Glioblastoma is one the example of our original developed tool without any FDA approvement.
Analytic measure tool of Glioblastoma is one the example of our original developed tool without any FDA approvement.
CT
Reference: Radiopaedia Website.
http://radiopaedia.org/articles/glioblastoma
- irregular thick margins: iso to slightly hyperattenuating (high cellularity)
- irregular hypodense centre representing necrosis
- marked mass effect
- surrounding vasogenic oedema
- haemorrhage occasionally seen
- calcification is uncommon
- intense irregular, heterogeneous enhancement of the margins is almost always present
- T1:
- hypo to isointense mass within white matter
- central heterogenous signal (necrosis, intratumoural hemorrhage)
- T1 C+:
- enhancement is variable but is almost always present
- typically peripheral and irregular with nodular components
- usually completely surrounds necrosis
- T2 / FLAIR:
- hyperintense
- surrounded by vasogenic oedema
- flow voids occasionally seen
- SWI:
- susceptibility artifact on T2* from blood products (or occasionally calcification)
- low intensity rim from blood product 6
- incomplete and irregular in 85% when present
- mostly located inside the peripheral enhancing component
- absent dual rim sign
- DWI: no diffusion restriction, however, lower measured ADC than low grade gliomas
- MR perfusion: rCBV elevated compared to lower grade tumours and normal brain
- MR spectroscopy:
- typical spectroscopic characteristics include:choline: increased
- lactate: increased
- lipids: increased
- NAA: decreased
- myo-inositol: decreased
- PET demonstrates accumulation of FDG (representing increased glucose metabolism) which typically is greater than or similar to metabolism in gray matter.
Reference: Radiopaedia Website.
http://radiopaedia.org/articles/glioblastoma
